
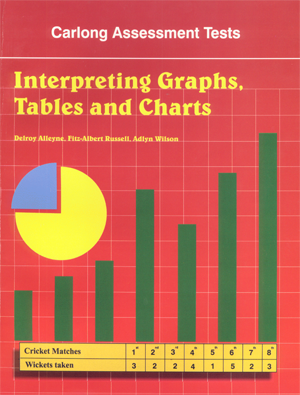
Carlong Assessment Tests: Interpreting Graphs, Tables and Charts
ISBN: 9789766380038
For Ages: 10-13 years
- Fitz-Albert Russell
- Delroy Alleyne
- Adlyn Wilson
This workbook enables pupils to analyse, evaluate and draw conclusions from data presented in a variety of formats: grids, tables, maps, pictographs, bar graphs, line graphs, circle graphs etc. This is a critical skill for every student from upper primary level onwards.
Key Features:
- Use of data relating to three subject areas: science, mathematics and social studies
- Each subject has three papers of 50 items each
- Varied formats: Paper 1 for each student consists of short answer questions. Papers 2 and 3 are multiple choice
- Worked examples: Paper 1 in each subject is specially prepared to guide the pupils
Look Out For:
- Notes to the Students which explains, simply and in detail, vital information on the interpretation of data
- A worked example to begin each set of questions on a graph or chart or other stimuli
- Wide variety of data presentation: grids, tables, maps, pictographs, bar graphs, line graphs and circle graphs (pie charts)
- Pull-out answer sheets