Textbooks
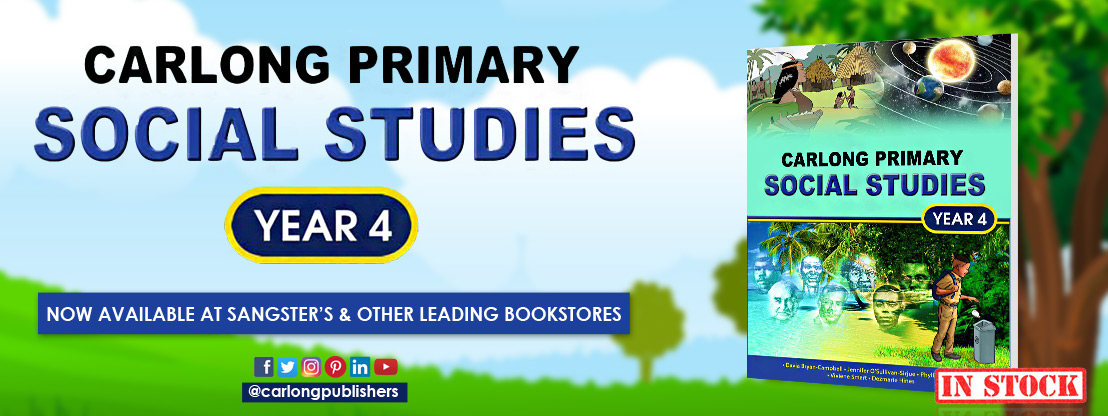
We have an assortment of textbooks suitable for reading at the early childhood, primary, secondary, and post-secondary levels.

Leisure Reading
We now have a collection of trade titles for enjoyment by all ages! The Sand Pebbles Pleasure series and Expressions books were created to capture the interest and imagination of youths.


Learning Portal
Our learning portal is an extension of our textbooks, which makes it easy for
students to access and practice skills on their smart devices.
Try our exercises and games!
We will respond in at least 48 hours.
- Description
- Specifications
For Ages: 10-13 years
- Fitz-Albert Russell
- Delroy Alleyne
- Adlyn Wilson
This workbook enables pupils to analyse, evaluate and draw conclusions from data presented in a variety of formats: grids, tables, maps, pictographs, bar graphs, line graphs, circle graphs etc. This is a critical skill for every student from upper primary level onwards.
Key Features:
- Use of data relating to three subject areas: science, mathematics and social studies
- Each subject has three papers of 50 items each
- Varied formats: Paper 1 for each student consists of short answer questions. Papers 2 and 3 are multiple choice
- Worked examples: Paper 1 in each subject is specially prepared to guide the pupils
Look Out For:
- Notes to the Students which explains, simply and in detail, vital information on the interpretation of data
- A worked example to begin each set of questions on a graph or chart or other stimuli
- Wide variety of data presentation: grids, tables, maps, pictographs, bar graphs, line graphs and circle graphs (pie charts)
- Pull-out answer sheets
![]()
Executive, Marketing,
Publishing and HR
Building 3, 17 Ruthven Road,
Kingston 10, Jamaica, W.I.
Distribution Centre
38 First Street, Newport West,
Kingston 13, Jamaica, W.I.
Finance & Accounting
and Facilities & Operations
37 Second Street, Newport West,
Kingston 13, Jamaica, W.I.
![]()
Executive, Marketing,
Publishing and HR
Tel: (876) 960 9364-6 or 920-9972
Fax: (876) 968-1353
Distribution Centre
Tel: (876) 923-6505-7
Fax: (876) 923-7003
Finance & Accounting
and Facilities & Operations
Tel: (876) 923-6505-7, (876) 923-7008
Fax: (876) 923-7003


